Observium has been my graphing system of choice for a long while now, originally brought in to replace Cacti and Munin. Due to the brief documentation provided on their site on how to add new graphs using the agent system, I embarked on discovering this for myself (with the help of their guide) and as a result, I have put together the following guide.
Pre-Requisites:
1) The Observium agent must be fully installed and operational on the server you’re trying to monitor (check it’s listening on TCP/36602);
2) You’ll need a little bit of patience as it can be a little bit fiddly to get working, but very much worth the effort.
Create module on monitored server
#!/bin/bash

procs=$(ps -ef|grep "[h]ttpd" | wc -l)

echo "<<<app-apache_procs>>>"

echo $procs
It’s very important to start the script with the following (substituting *yourapp* with a name such as ‘apache_procs’):
echo "<<<app-*yourapp*>>>"
Once you have created this, make sure the file is executable and that it’s in the ‘/usr/lib/observium_agent/local’ directory so it can be executed by the agent:
# chmod +x myapp.sh && mv myapp.sh /usr/lib/observium_agent/local
You can now test this is working by connecting with telnet to the agent port of the server in question:
# telnet localhost 36602
...
<<<app-apache_procs>>>
12
Connection closed by foreign host.
...
#
Create Observium side scripts for collection and generation of graph data
Now that we have the easy bit out of the way, it’s time to create the relevant scripts for the module on the Observium server itself so that it is able to generate graphs and store RRD data. These consist of the poller include, application graph include and html page include.
In our guide, we use the base directory of ‘/opt/observium’ and you may need to change this to suit your setup. Create the following files on the Observium server:
./includes/polling/applications/apache_procs.inc.php
<?php
if (!empty($agent_data['app']['apache_procs']))
{
$rrd_filename = $config['rrd_dir'] . "/" . $device['hostname'] . "/app-apache_procs-".$app['app_id'].".rrd";
list ($procs) = explode("\n", $agent_data['app']['apache_procs']);
if (!is_file($rrd_filename))
{
rrdtool_create($rrd_filename, " \
DS:procs:GAUGE:600:0:125000000000 ");
}
rrdtool_update($rrd_filename,  "N:$procs");
}
?>
./html/includes/graphs/application/apache_procs.inc.php
<?php
if (!empty($agent_data['app']['apache_procs']))
{
$rrd_filename = $config['rrd_dir'] . "/" . $device['hostname'] . "/app-apache_procs-".$app['app_id'].".rrd";
list ($procs) = explode("\n", $agent_data['app']['apache_procs']);
if (!is_file($rrd_filename))
{
rrdtool_create($rrd_filename, " \
DS:procs:GAUGE:600:0:125000000000 ");
}
rrdtool_update($rrd_filename,  "N:$procs");
}
?>
./html/pages/device/apps/apache_procs.inc.php
<?php

/**
* Observium Network Management and Monitoring System
* Copyright (C) 2006-2014, Adam Armstrong - http://www.observium.org
*
* @package    observium
* @subpackage applications
* @author     Adam Armstrong <adama@memetic.org>
* @copyright  (C) 2006-2014 Adam Armstrong
*
*/

$app_graphs['default'] = array('apache_procs' => 'Processes');

// EOF
Conclusion
If you have carried out the steps above correctly then you should see a graph populate underneath the ‘Apps’ tab in Observium for the host you’re monitoring (it can take 5 minutes for the broken graphs to appear and a further 10 minutes for any sort of useful data to appear on the graph, so be patient!)
If you don’t see anything under the apps tab or your graphs are broken after 10 minutes then you can debug the process by running the poller manually with the debug switch as such:
# cd /opt/observium
# ./poller.php -h <monitored_host> -d
The above command will show lots of output including any database queries it executes relating to MySQL. It should also show the creation or update of the RRD files relevant to your various agent modules.
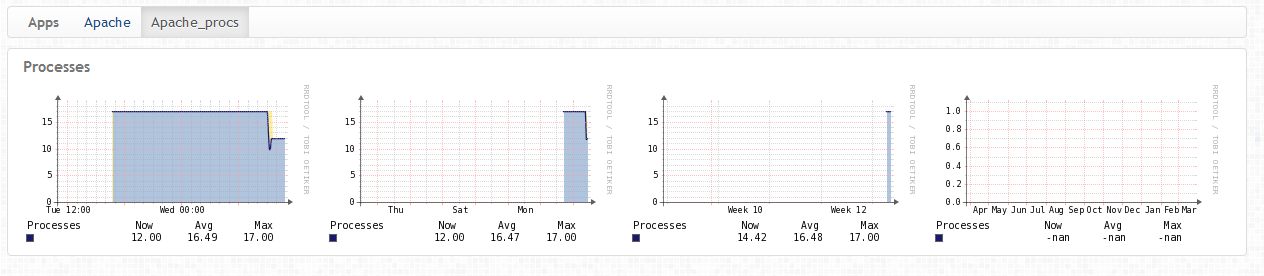
If everything is working, you should see something similar to below (please note there is significant amounts of data on this graph already as it had been populating for a good few hours):
One Comment